Triage Findings
Findings arrive continuously. This guide is the working routine for deciding, per finding, whether to fix it, suppress it, or tune the policy that raised it.
Start at the Findings List
Monitoring → Findings shows every finding with severity, workspace, profile, resource, and issue:
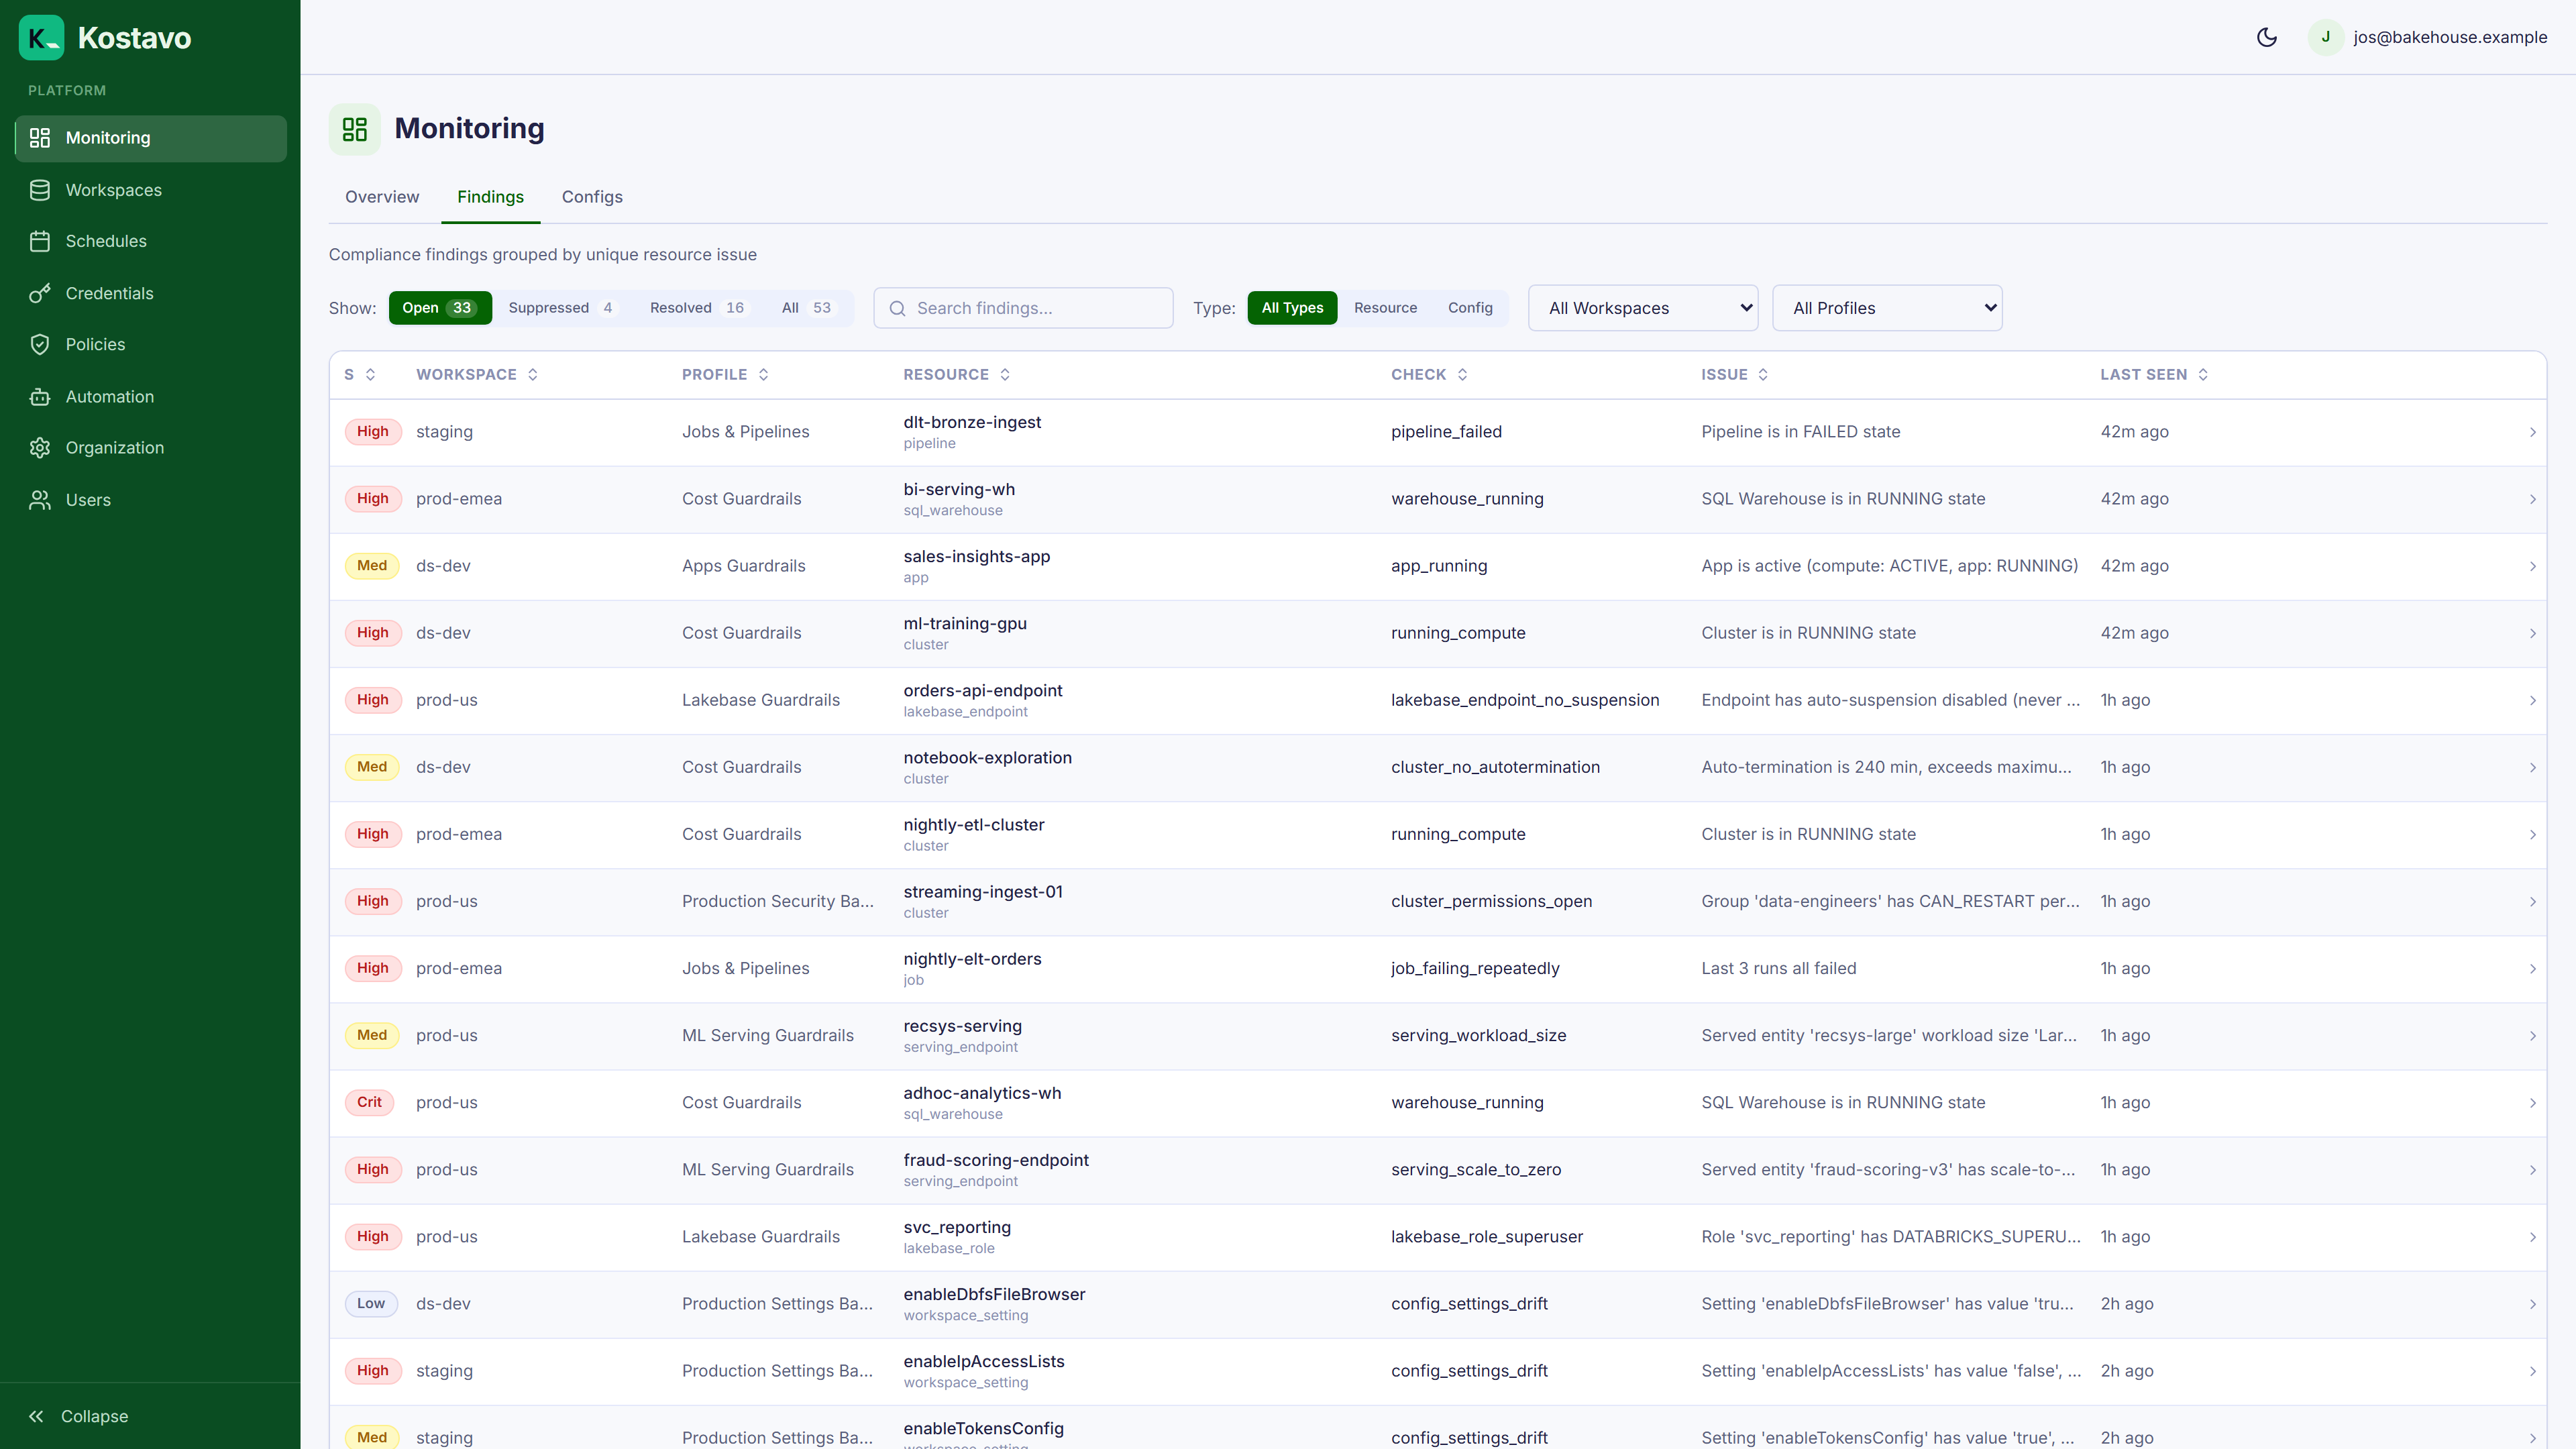
A triage-friendly order of attack:
- Filter status to Open
- Sort by severity, deal with critical and high first
- Use the workspace and profile filters to divide work between owners
Read the Detail
Click a finding to open its detail panel:
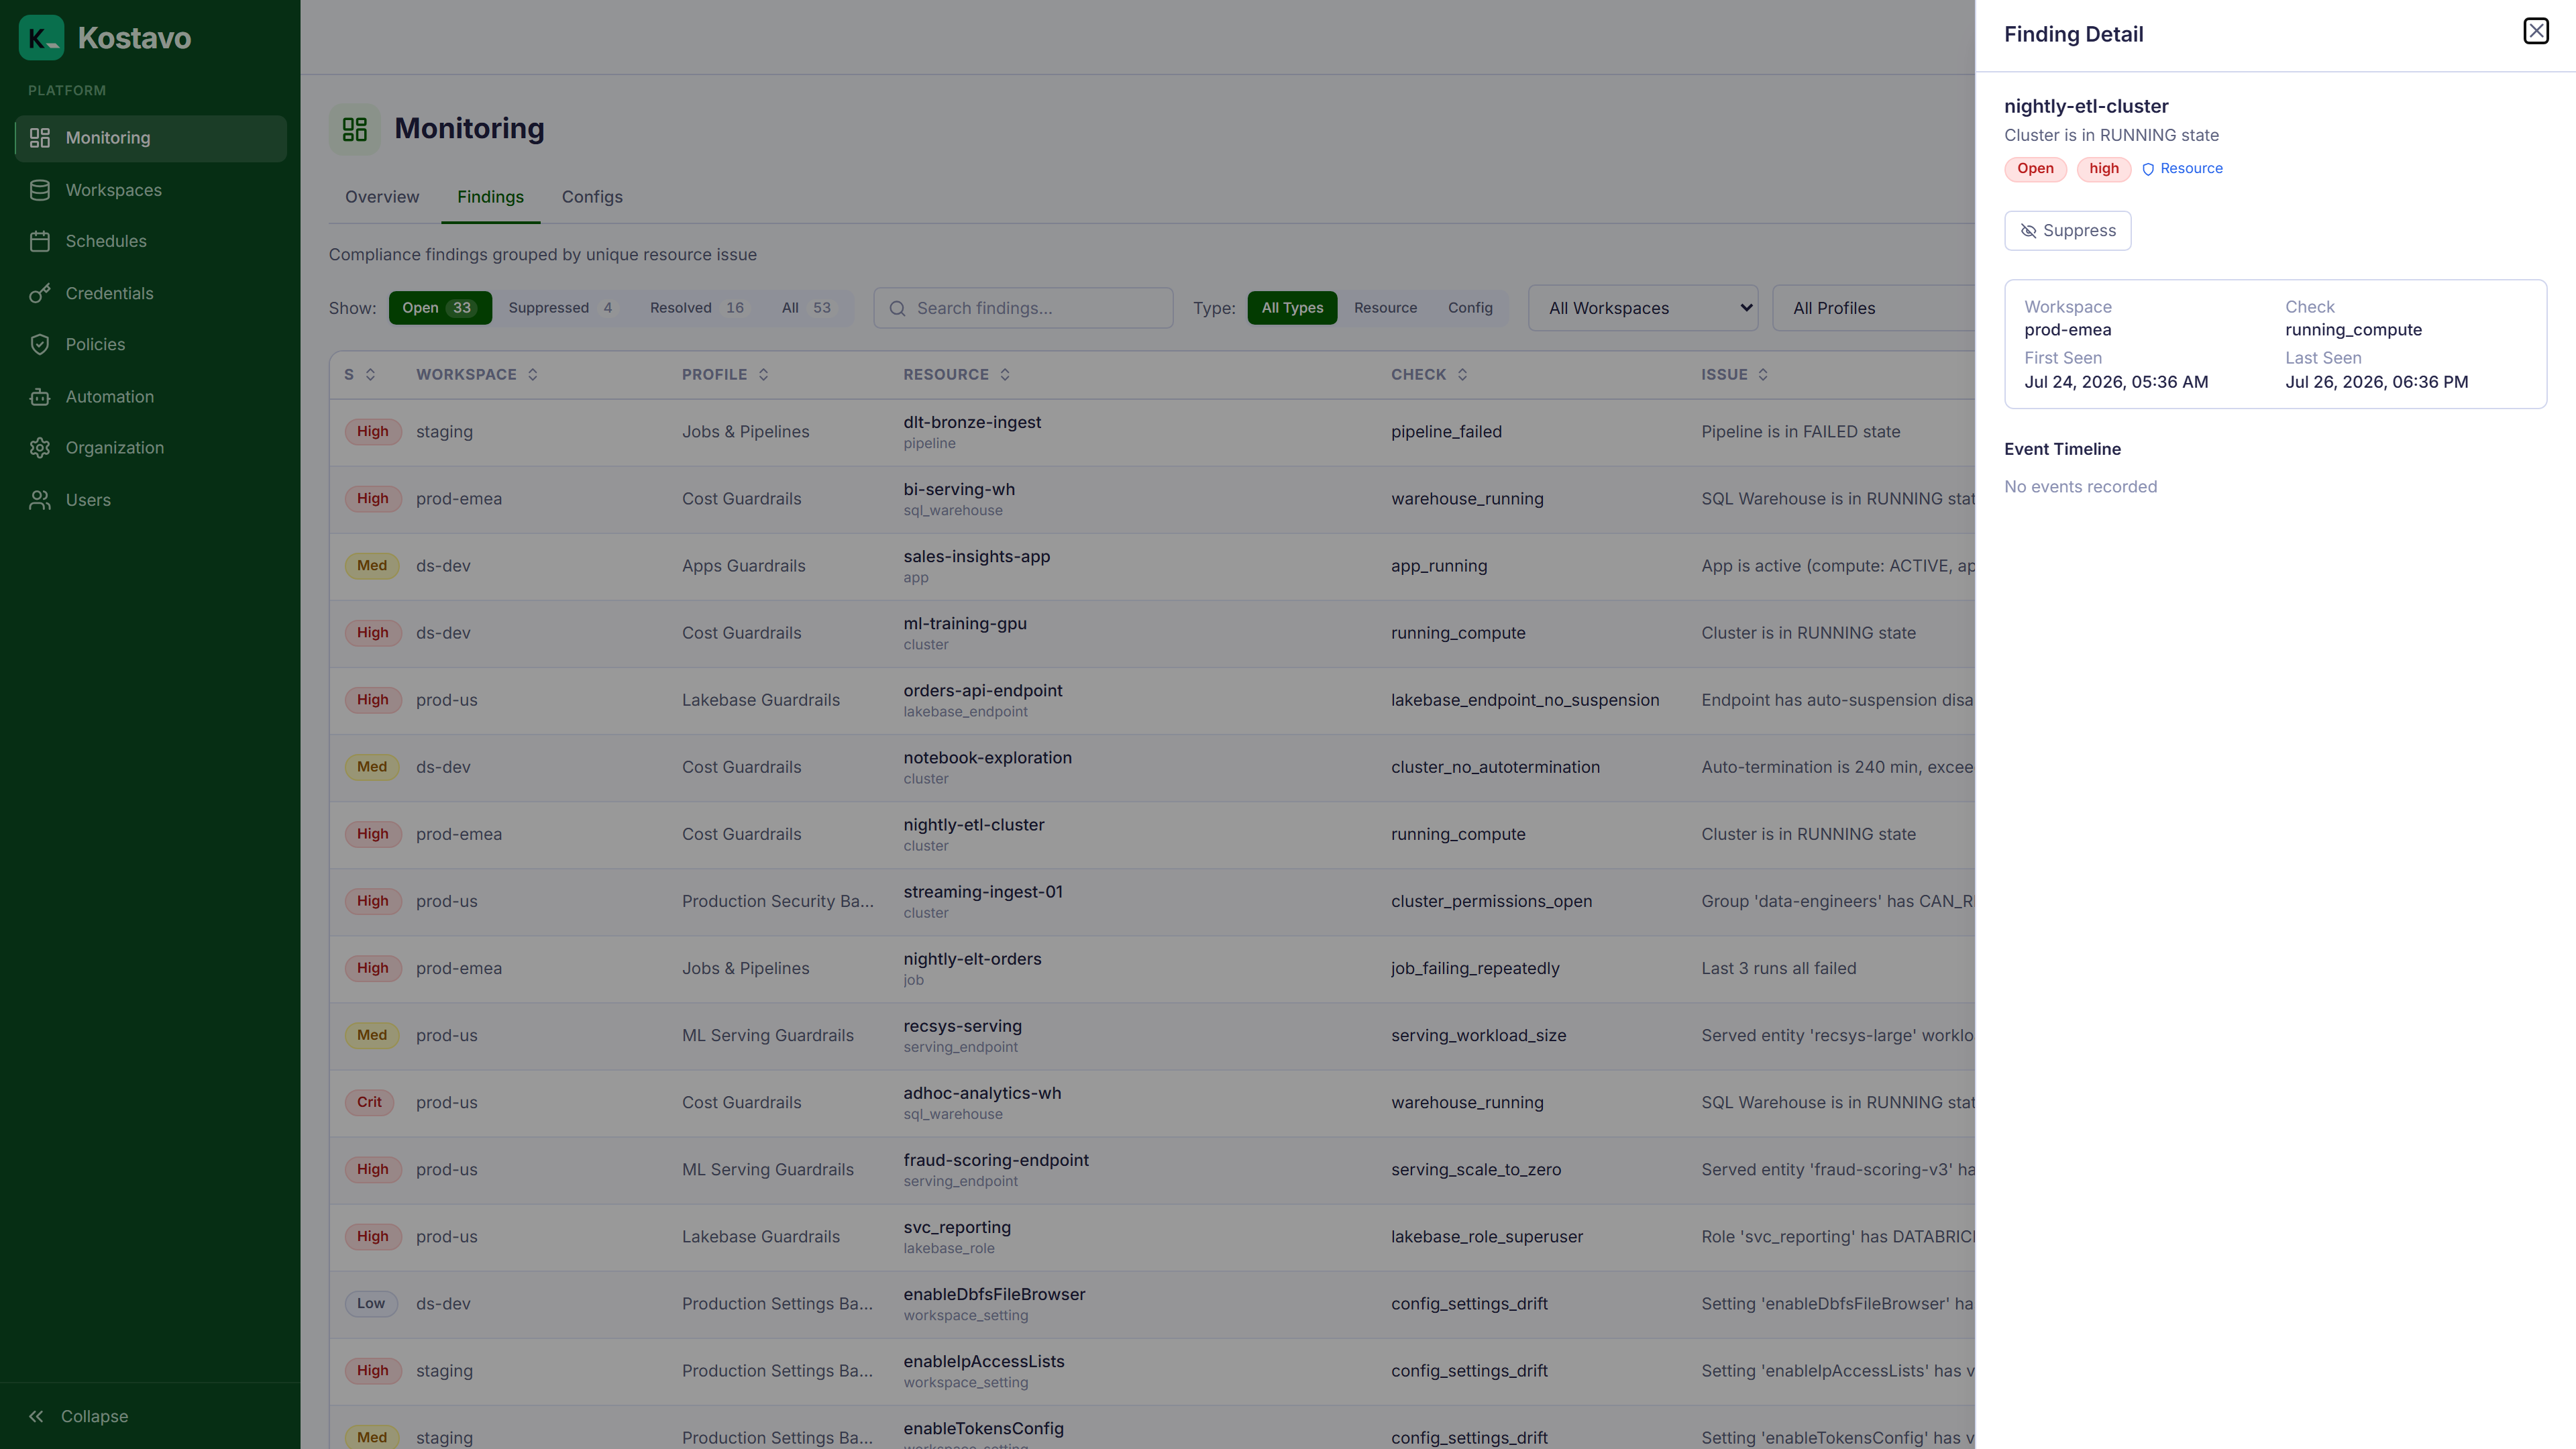
The fields that drive your decision:
| Field | What it tells you |
|---|---|
| Issue | What the policy detected, in the policy's own words |
| Action taken | NOTIFIED means nobody acted yet; FIXED or REMOVED means Kostavo already handled it; FAILED means it tried and could not |
| First seen / Occurrences | One-off or chronic. Fourteen occurrences over three weeks is a process problem, not an incident. |
| Last seen | Whether the issue is still current |
Decide: Fix, Suppress, or Tune
Every finding resolves into one of three moves.
The issue is real
Fix it in Databricks (or change the policy's action mode to Fix so Kostavo handles the whole category from now on). You do not close findings by hand: once the policy stops detecting the issue, the finding auto-resolves after the configured number of clean runs.
The resource is intentionally like this
Suppress the finding from the detail panel, or add the resource to the policy's exception list if the exemption is permanent. For how the two differ, see Suppress vs exception.
The policy is miscalibrated
If the same policy floods you with findings nobody acts on, the policy is wrong, not the fleet. Adjust its custom settings (thresholds), lower its severity, or drop it from the profile.
Understand Auto-Resolution
You never manually close a finding; the lifecycle resolves it once the policy stops detecting the issue. So the correct response to "I fixed it" is: do nothing. Watch it resolve over the next scans. If it does not, your fix did not take.
Check the Execution History
The detail panel links each finding to the scan executions that produced it: when policies ran, how long they took, and what actions were taken. Use it to answer "why did this get stopped at 02:00 Saturday" with an exact policy, profile, and timestamp.
Escalation Signals
| Signal | Response |
|---|---|
| Action taken shows FAILED repeatedly | Check credential permissions on that workspace (Managing credentials) |
| Critical security findings on production | Handle now; consider immediate notifications at the high threshold |
| The same resource cycles open/resolved | The fix is cosmetic or someone keeps reverting it; look at the resource's owner |
Related
- Concept: Findings for the full lifecycle model
- Guide: Set up Slack and Teams notifications so triage starts from an alert, not a habit
- Reference: Action modes