Dashboard Tour
The Monitoring page is Kostavo's home screen: a live health summary of every governed workspace. This tour covers what each part means, and how to read it as an operator rather than a spectator.
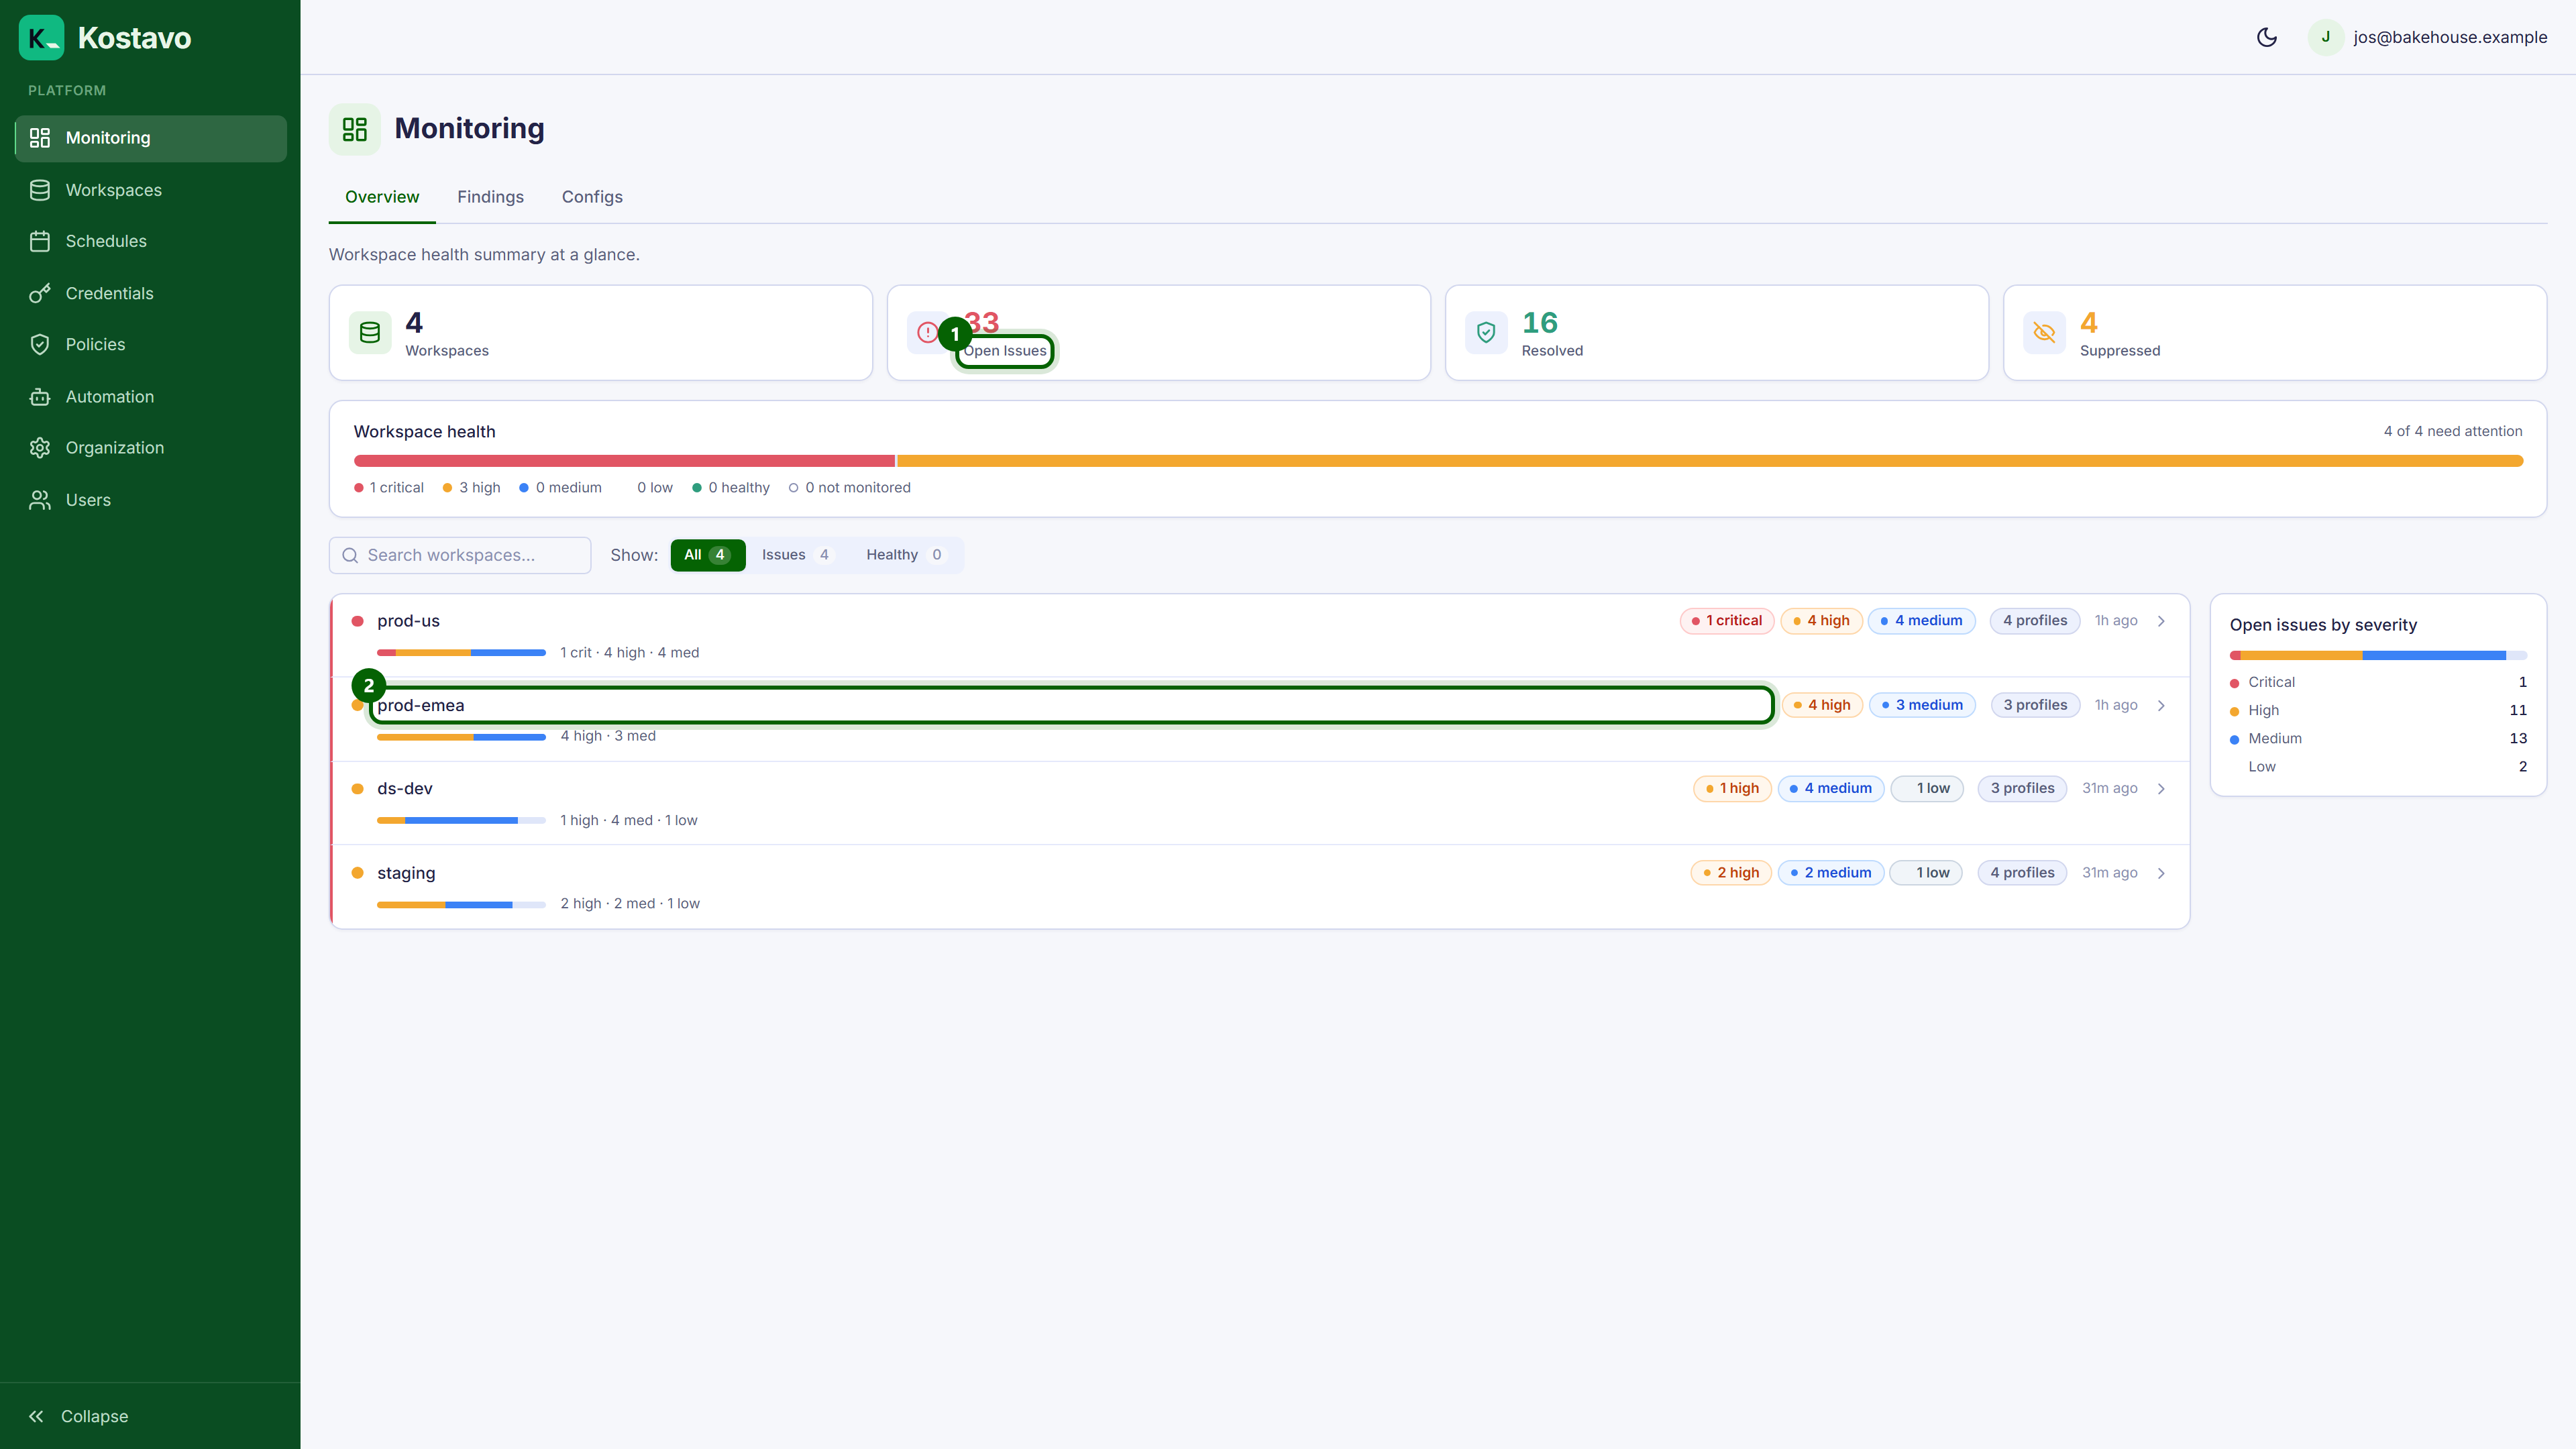
1. Summary Cards
Across the top, four counters summarize the whole estate:
| Card | Meaning |
|---|---|
| Workspaces | Governed workspaces (connected and assigned at least one profile) |
| Open Issues | Findings currently open across all workspaces |
| Resolved | Findings that auto-resolved after the issue disappeared |
| Suppressed | Findings you chose to ignore |
The Resolved and Suppressed cards are links: click them to jump straight to the findings list filtered to that status.
2. Workspace Fleet Health
Workspaces are bucketed by the worst severity of their open issues, shown as a severity bar plus a card per workspace. The list is sorted so it reads top-down as a priority queue: workspaces with issues first, healthy ones next, and not-monitored ones last.
- Healthy means governed with no open issues.
- Not monitored means the workspace is connected but has no profile assigned, so nothing is scanning it. Fix that under assignments; an unmonitored workspace looks clean while costing you money.
Use the All / Issues / Healthy filter to focus, and click any workspace card for its full finding and execution history.
Tabs: Overview, Findings, Configs
The Monitoring section has three tabs:
- Overview: the dashboard you are looking at
- Findings: the full findings list with filters for status, severity, workspace, and profile. This is where triage happens.
- Configs: workspace settings compared against your configuration baseline. See Configuration drift.
Reading It Day to Day
What healthy looks like: Open Issues low and stable, Resolved climbing steadily (issues appear and get cleaned up, by Kostavo or by your team), zero not-monitored workspaces.
Signals worth acting on:
| Signal | What it usually means |
|---|---|
| Open Issues climbing week over week | New workload patterns your profiles do not cover, or Fix mode disabled where it should not be |
| A workspace sitting in the issues bucket for days | Findings nobody owns. Route them to the team with a notification channel. |
| Suppressed count creeping up | Suppression being used instead of fixing policies or adding exceptions. Review what got suppressed and why. |
| Workspaces in "not monitored" | Enrolled but ungoverned. Assign a profile or use tag rules so this state cannot persist. |
A practical routine: glance at Open Issues daily and chase anything new at high severity; once a week, review the Suppressed list and clear the not-monitored bucket.
When the Dashboard Is Empty
Before any workspace is connected, all counters read zero and the page points you at onboarding:
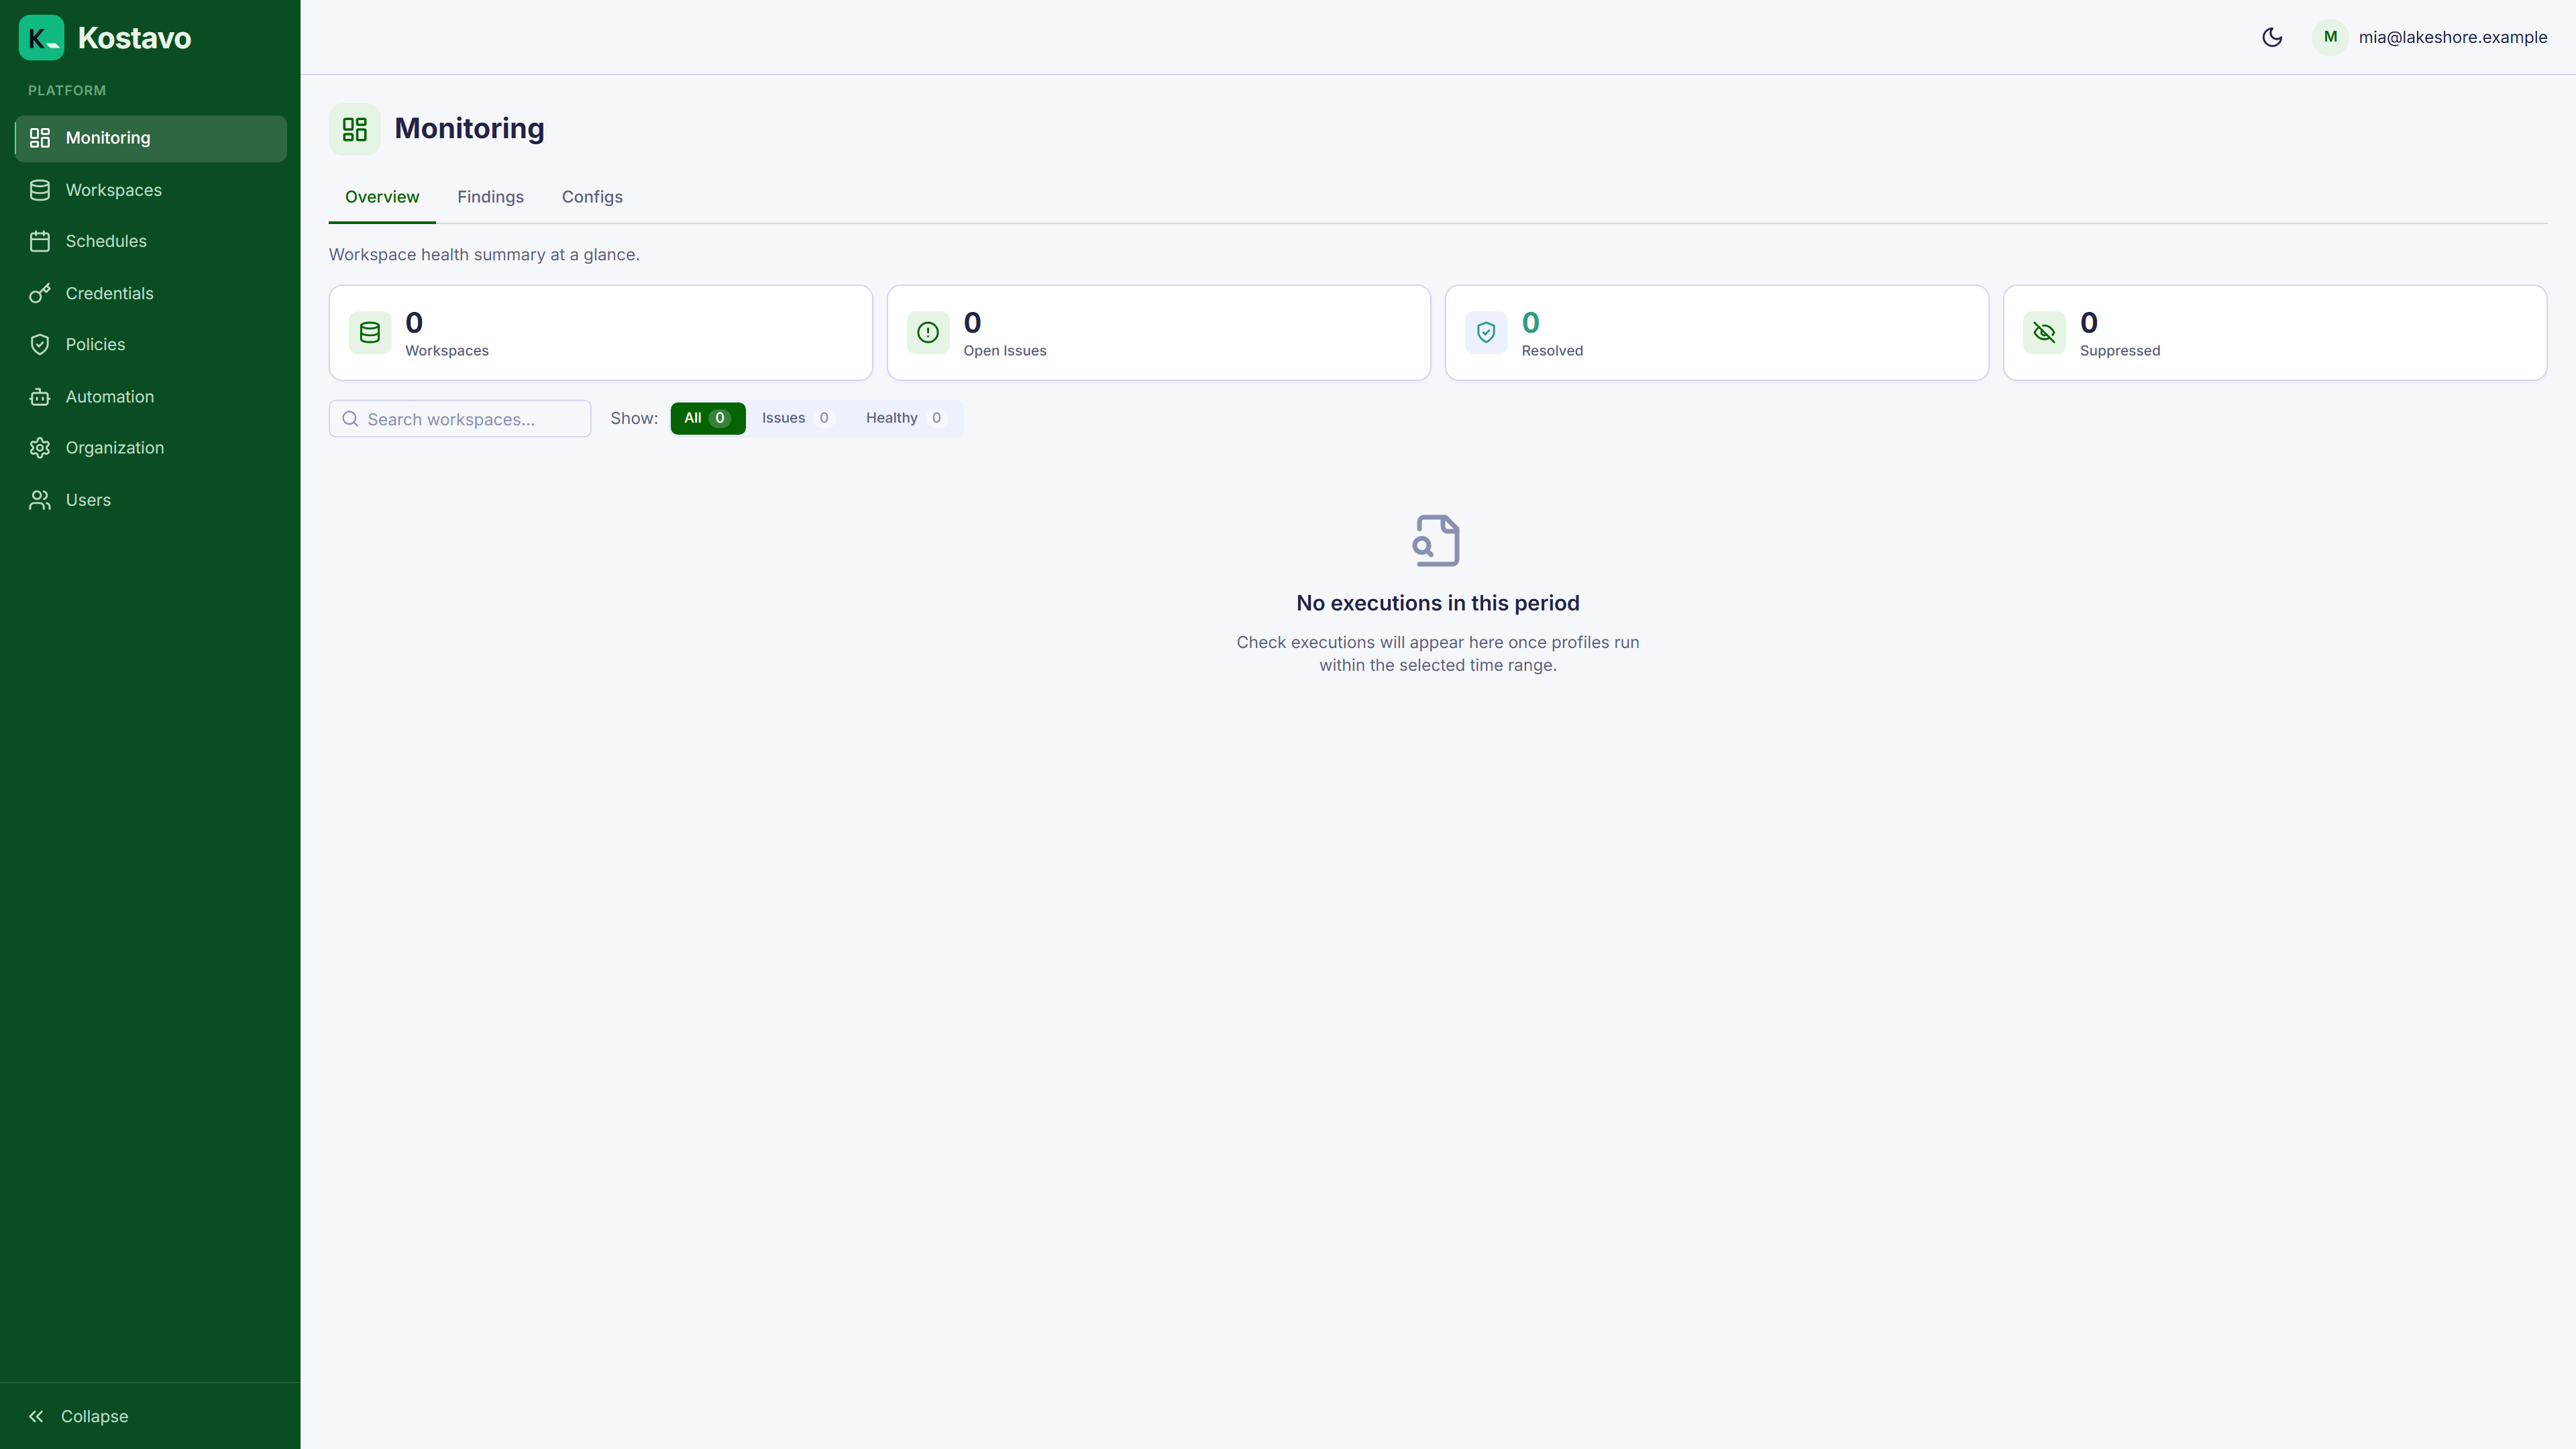
If you are looking at this screen, start with Your first 30 minutes.
Related
- Guide: Triage findings
- Concept: Findings explains the lifecycle behind the counters
- Concept: Configuration drift for the Configs tab